|
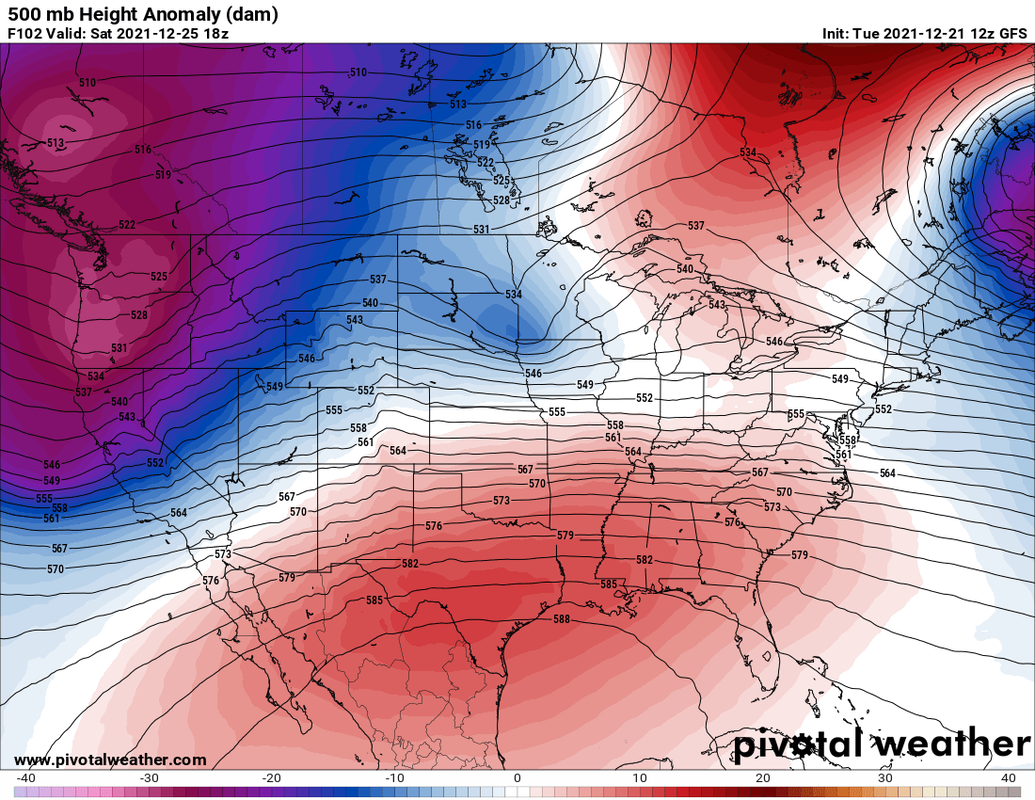
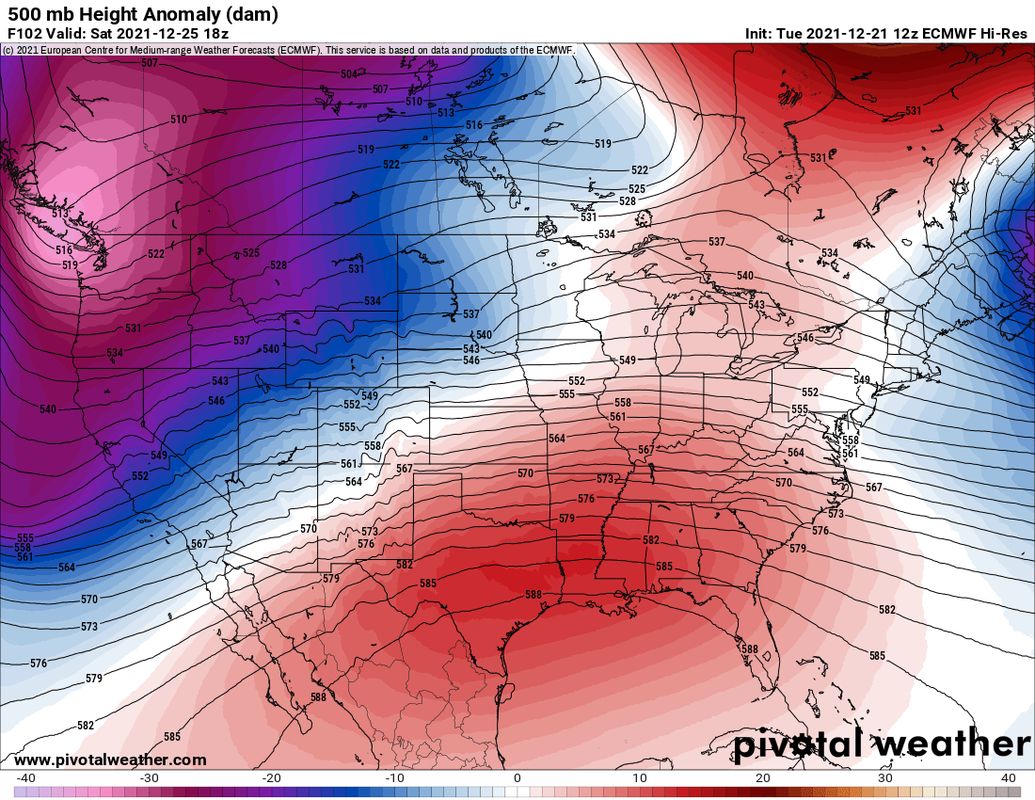
I'm dreaming of a white... uh warm Christmas? Its been warm lately, which is probably an understatement considering I was able to wear shorts part of last week. This warmth will set the stage for any possible white Christmas or pattern to follow us into the new year. 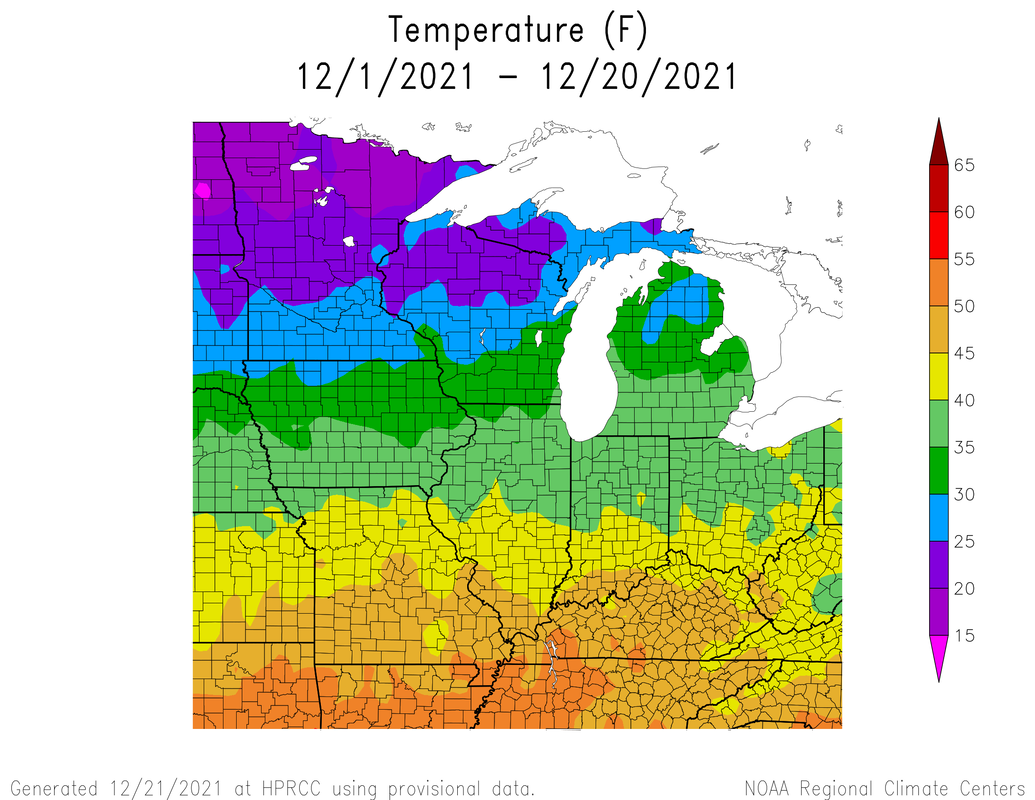 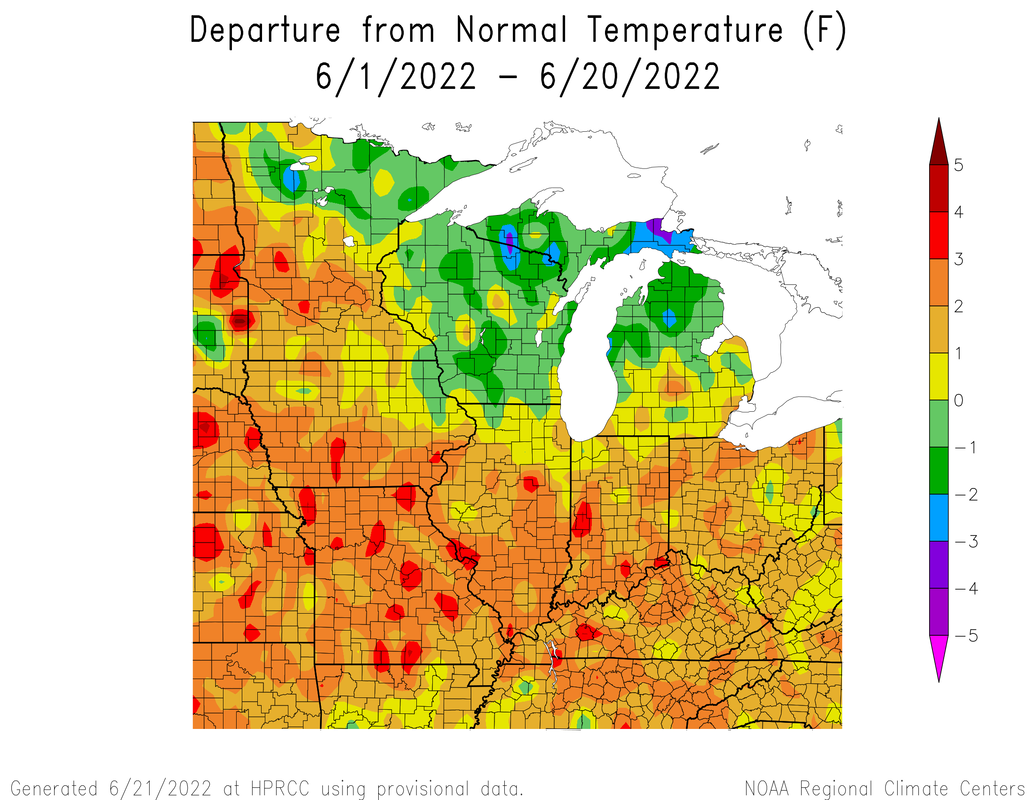  It is glaringly obvious that it has been a warm month. Between the 1st and the 20th, temperatures across the Midwest were between 2-10+ deg above the climate average. Actually, so far it has been one of the hottest Decembers to date in many areas. Teleconnections have not been in our favor for cold conditions to develop. 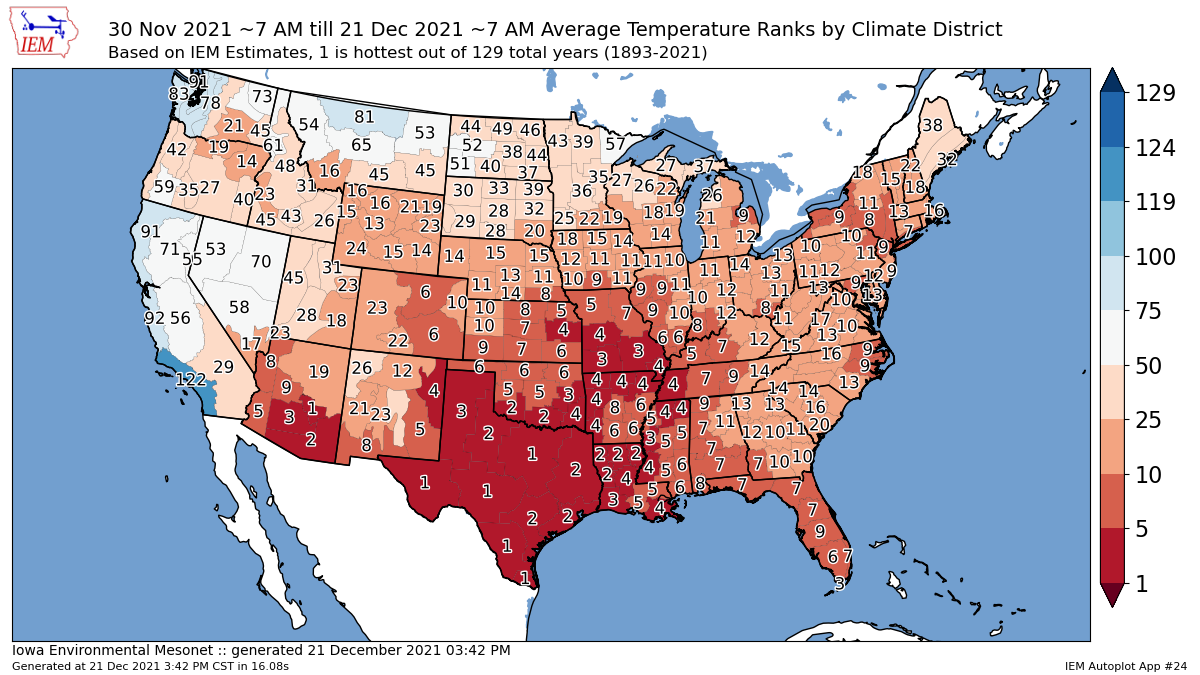  Here is our climatology for seeing a white Christmas any given year using the most recent set of climate normals. In any given year for north central Indiana there is around a 20-40% chance of seeing snow on the ground on Christmas day. 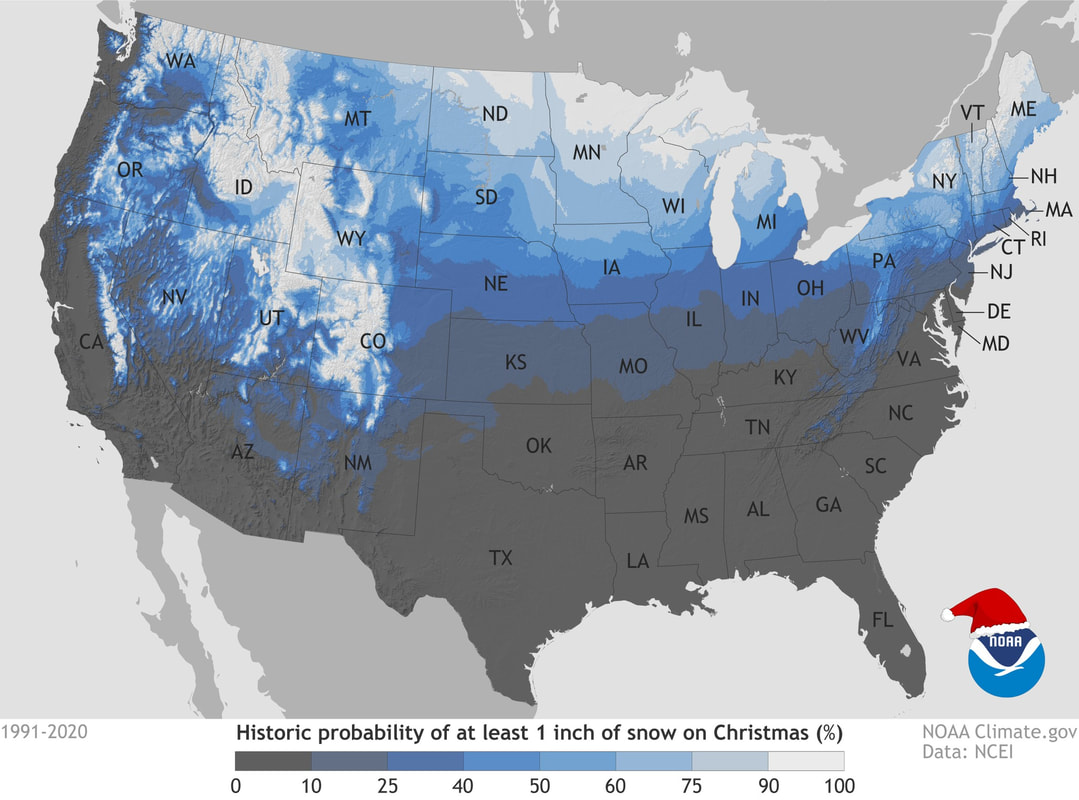 The big question of the day is how much of a chance we have for a white Christmas here in Kokomo. This year I am forecasting a 0% of a white Christmas. Trust me I want snow as much as you all do. Analogs for this time indicated a higher-than-normal chance, but the blocking just hasn't set up for cold air to stick around long enough for snow. More on that later. Here is my reasoning why. Here are the 500mb heights midday Saturday.
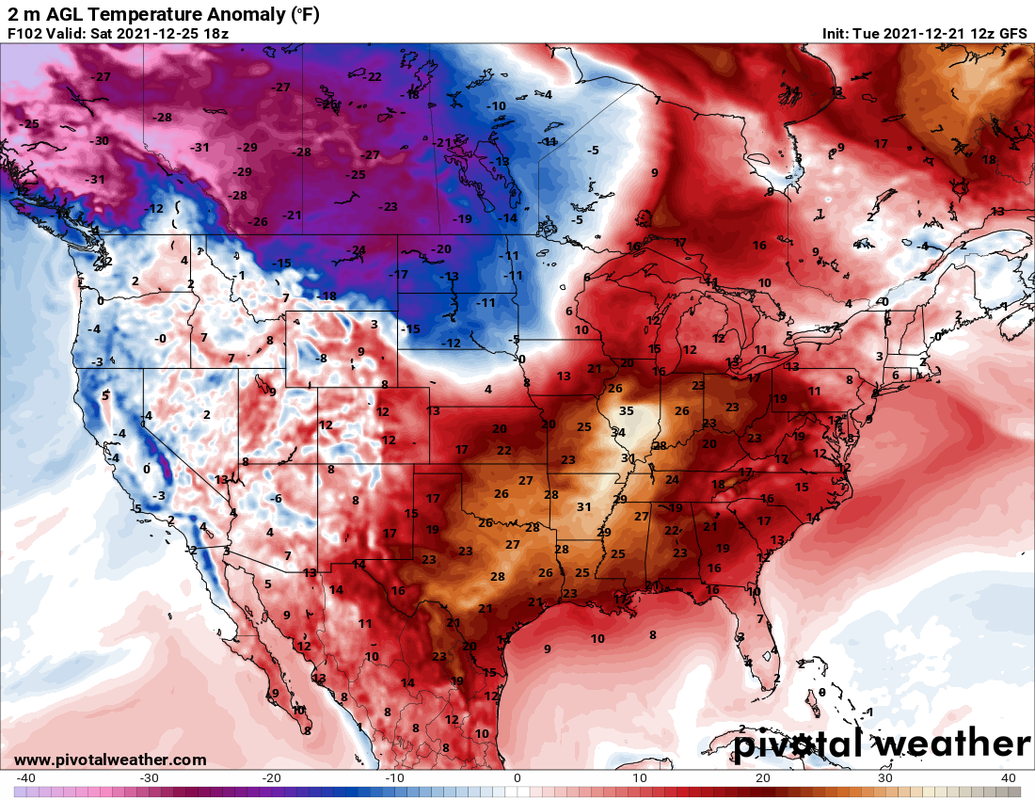
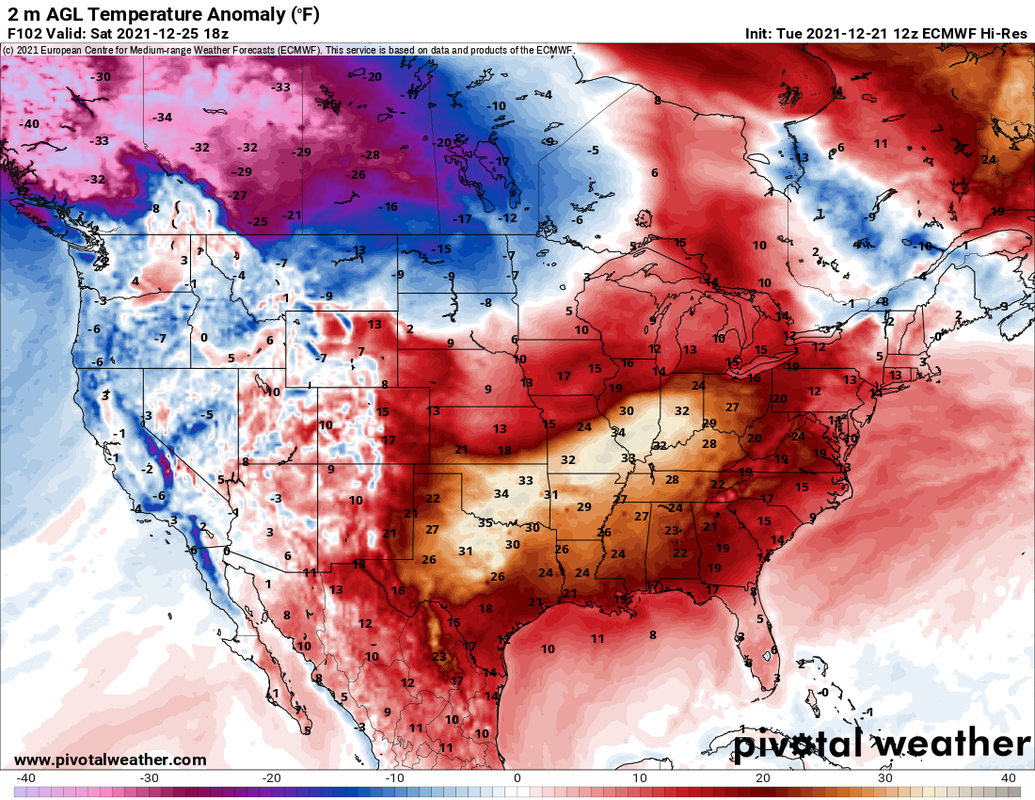
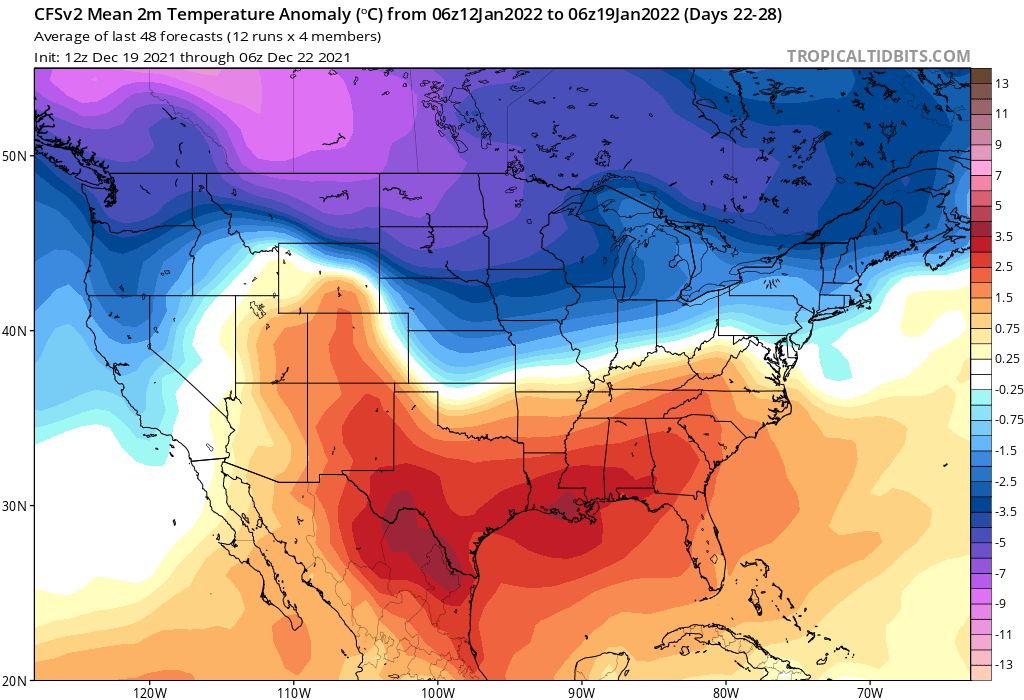
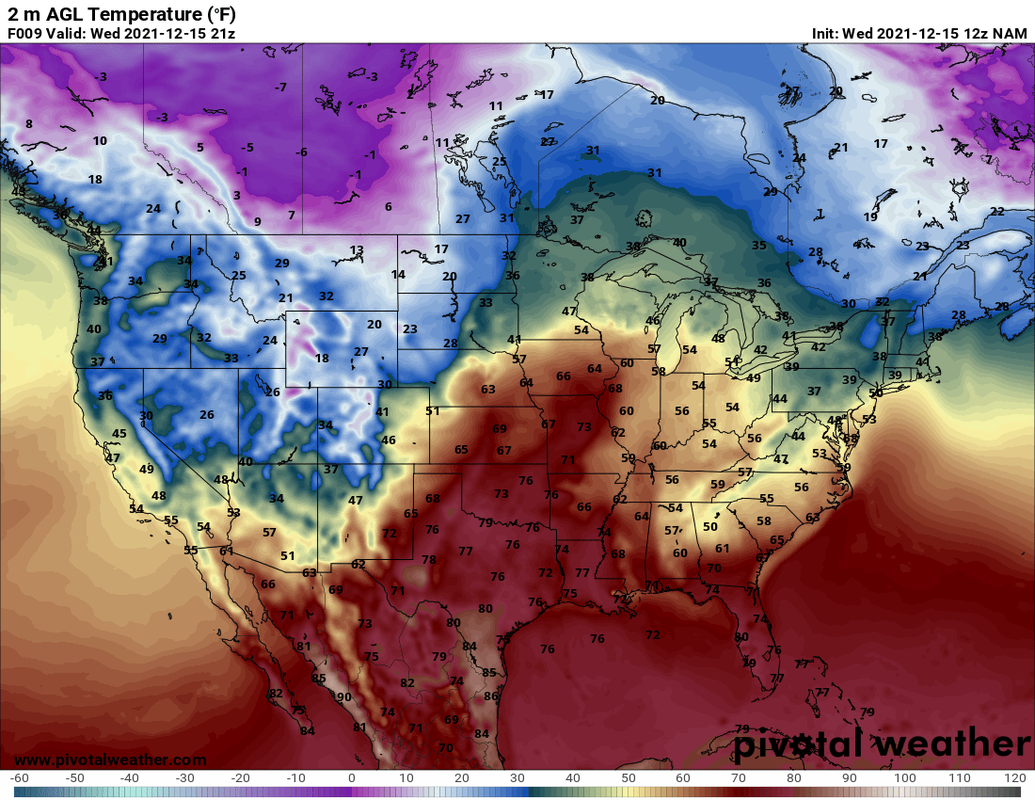
Higher heights at 500mb are associated with warmer temps due to the sinking air associated with centers of high pressure. Next shown are surface temperature anomalies. Both the operational GFS and Euro models show areas of 20-30+ degrees higher than normal. Some areas in central Texas could see highs in the 80s!
For fun here are the record temps in December since 1994. A couple models want us to approach record territory, but I would want to see more data come in before making a definitive temperature forecast. 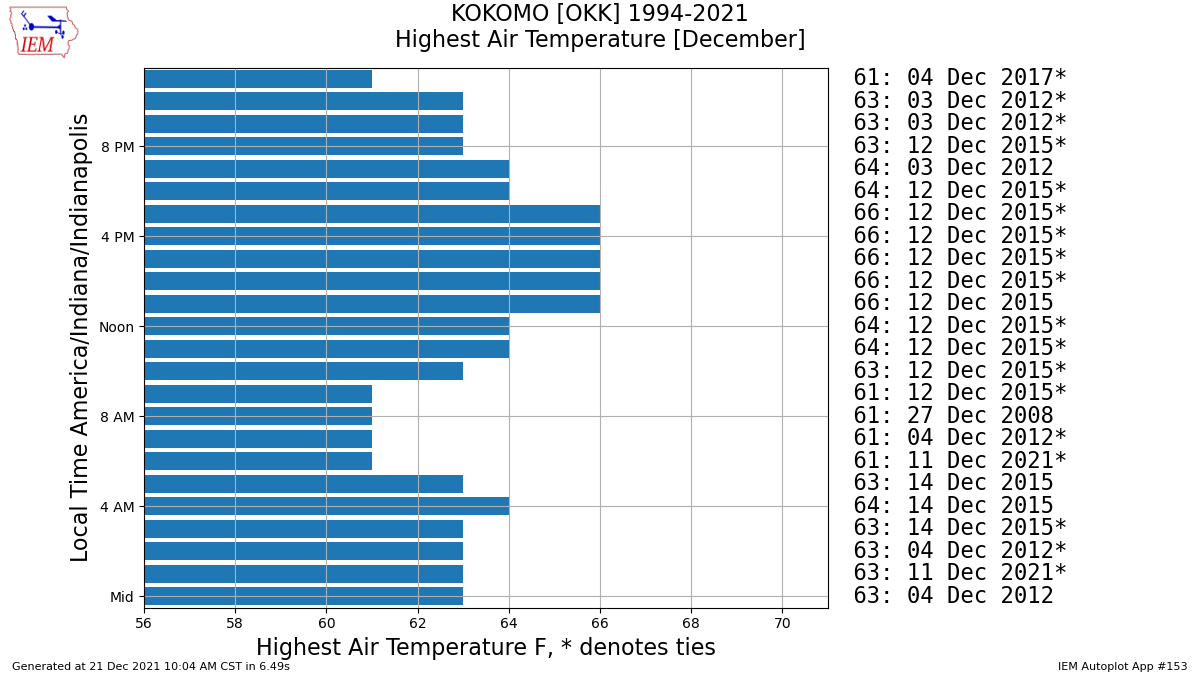 The Climate Prediction Center has outlined virtually the entire eastern half of the US in above average temperatures for the next couple weeks. So what does this mean?   Looking at models through New Years Eve.
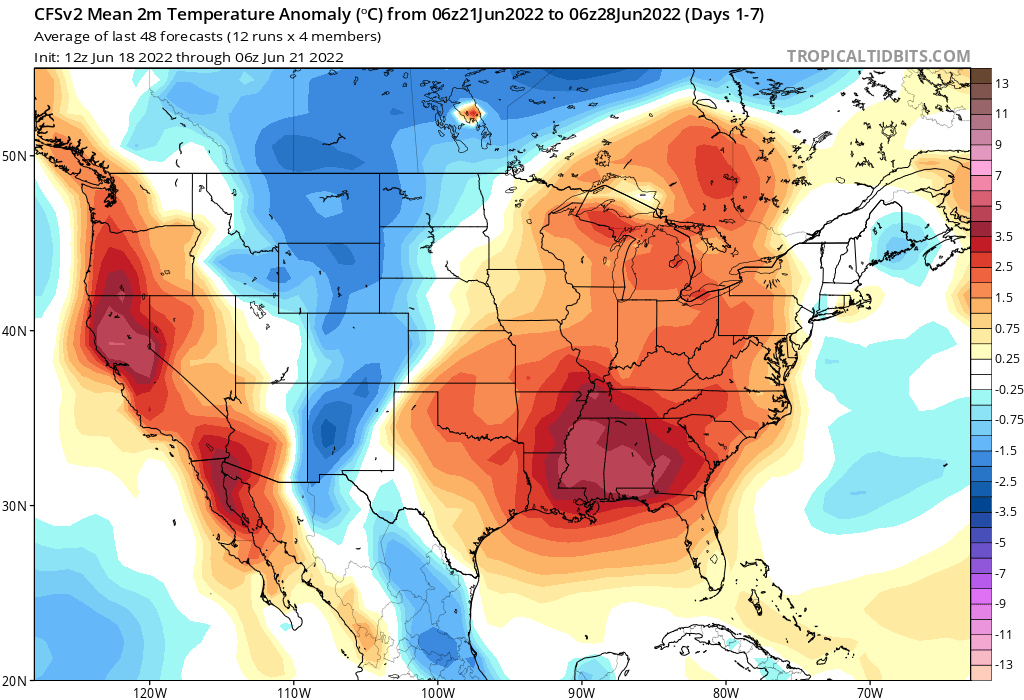
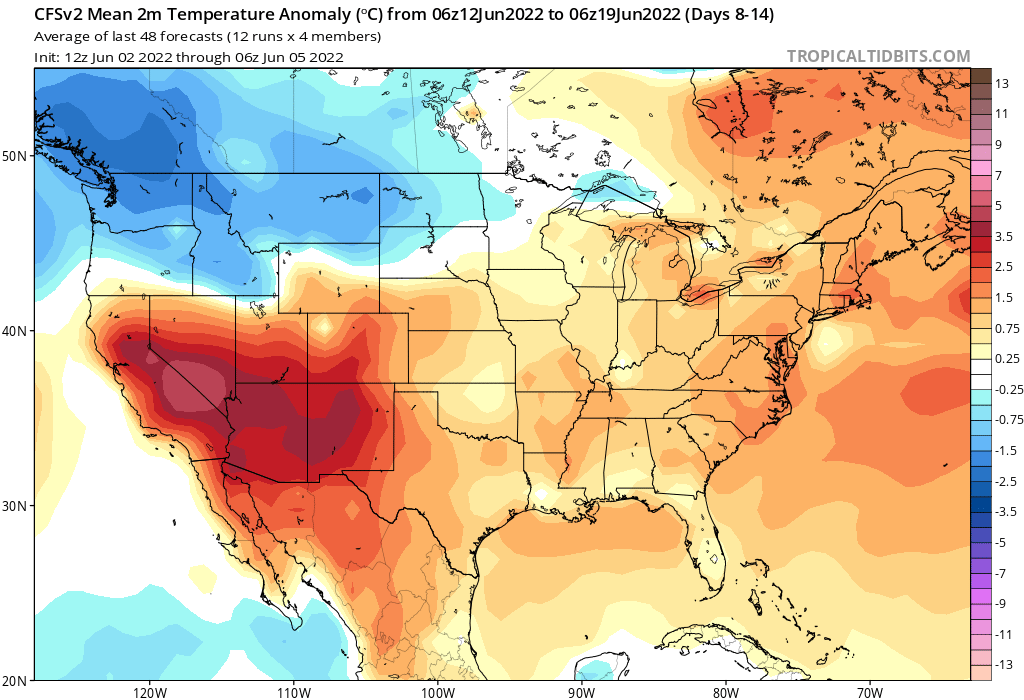
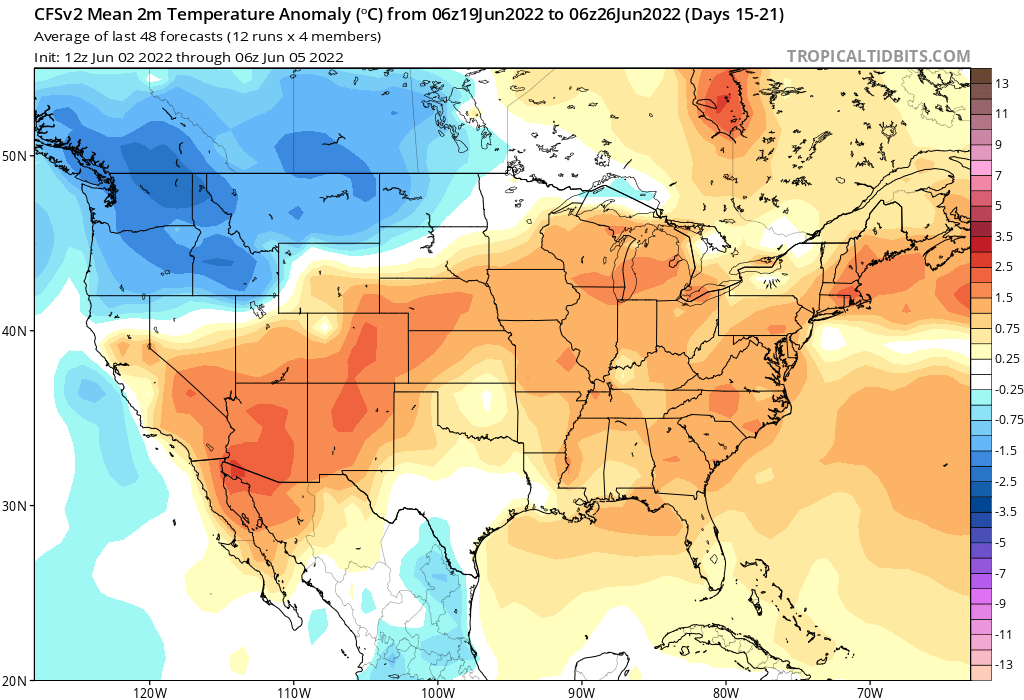
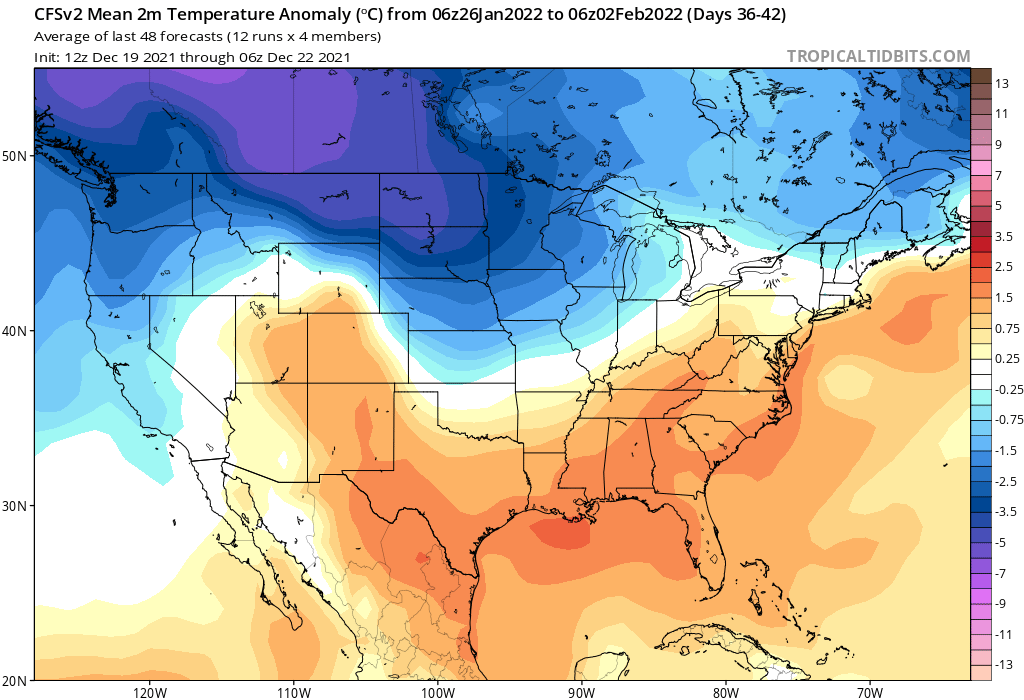
So clearly the year will end warm, but why and how will we enter the new year? Will there be a winter? Answer to question #2 is we only just started winter yesterday! We have a long season to go. A good meteorologist just doesn't only use models but looks at patterns as well. You know I use teleconnections along with models in a more organic method. The teleconnections I look at more often are ENSO, NAO, PNA, and the MJO. First is the El Nino southern oscillation or El Nino/La Nina. It is the variation in sea surface temperatures and trade winds in the central-eastern Pacific Ocean. 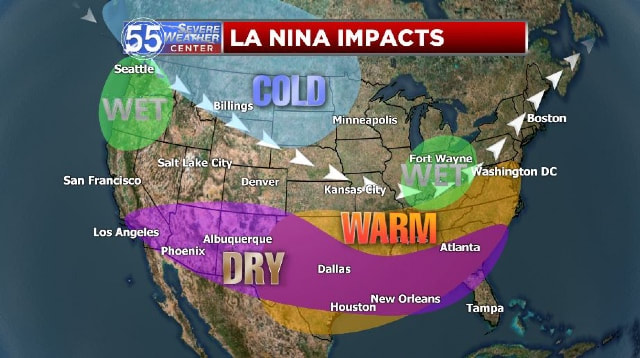 The NAO and PNA is the presence of troughs and ridges in certain areas. These two along with a couple other is basically Newtons third law. "For every action, there is an equal and opposite reaction." If the atmosphere develops a strong ridge at location x, the atmosphere reacts by creating a trough downstream of the ridge at location y. Now applying that to the teleconnections, If we have a (-)NAO that means there is ridging around/south and Greenland and with newtons third law means troughing over the central and eastern US. This would then allow cooler air in. A trough south of Greenland would the force ridging in the US. The PNA is quite similar in a (+)PNA means ridging along the west coast, so follow the wave and find a trough eastward then vice versa with its negative phase. The MJO is a bit different. It is a 30-60m cycle of tropical convection near the equator in the Indian ocean and SE Asia through 8 phases. Each phase indicates cooler/warmer or drier/wetter pattern here. Let's put it all together. The warm trend we are seeing now and will be seeing through at least New Years is supported by a more neutral NAO, a very negative PNA, and the MJO has stalled out in phase 6-early 7 which are warm phases. Afterward, teleconnections aren't too supportive for sustained cold. The MJO wants to head into phases 7.8.1, but models want it to stall out in phase 7. There was a typhoon in that area, which has quite likely stalled the convection and just delayed the movement into the cooler risk phases. After New Years, the NAO looks to be more neutral to somewhat negative and the PNA looks to become somewhat less negative. Another one I look at is the EPO or eastern pacific oscillation. Its negative phase can result in artic outbreaks in North America. It is currently negative. My theory right now is that while many of the teleconnections favor a cooler pattern, the PNA is not (very negative) which is throwing a wrench in the atmospheric works. Here are the CFS weeklies showing my general idea. The weeklies certainly show warmth, but more a of a pattern change in week 4. The west coast troughing, or negative PNA signal breaks down/weakens and allows more cold air into infiltrate the Midwest. This pattern we are in is hard to break so we really need the PNA to flip to get more wintery pattern to develop. It should be noted that even with a warm pattern, if its active, a storm system can still pull-down cold air in brief shots.
I think our winter pattern has not been denied, but delayed. Last year the pattern flipped in late January and we had true winter weather in the second half of the season. It could be similar with another backloaded winter this year as well. Some of the longer range models are showing cold blasts after new years, but I will wait until the models are out of fantasyland. Everyone have a merry Christmas!
0 Comments
It would not be much of a stretch to ask your "Where is winter?" Locally temperatures been anywhere from 4-8 degrees above average. The whole continental United States have been above average over the last couple of weeks in fact. During this period the teleconnection signals showed a (+)NAO and (-)PNA along with phases 5-6 showed a warm pattern. Teleconnections are connections between atmospheric conditions at one point and another. The NAO and PNA are the 500mb height patterns over Greenland and the western United Sates respectively. The MJO or Madden-Julien Oscillation is the movement of strong tropical convection along the ITCZ (intertropical convergence zone) in a 30-60 day cycle. 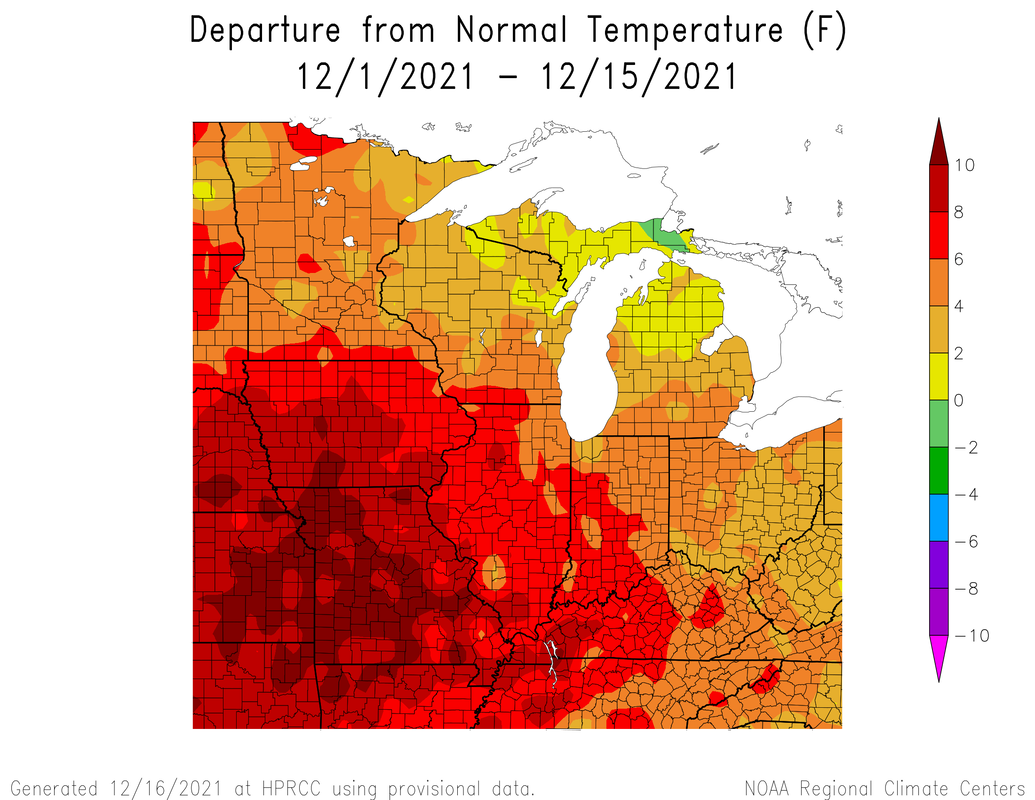 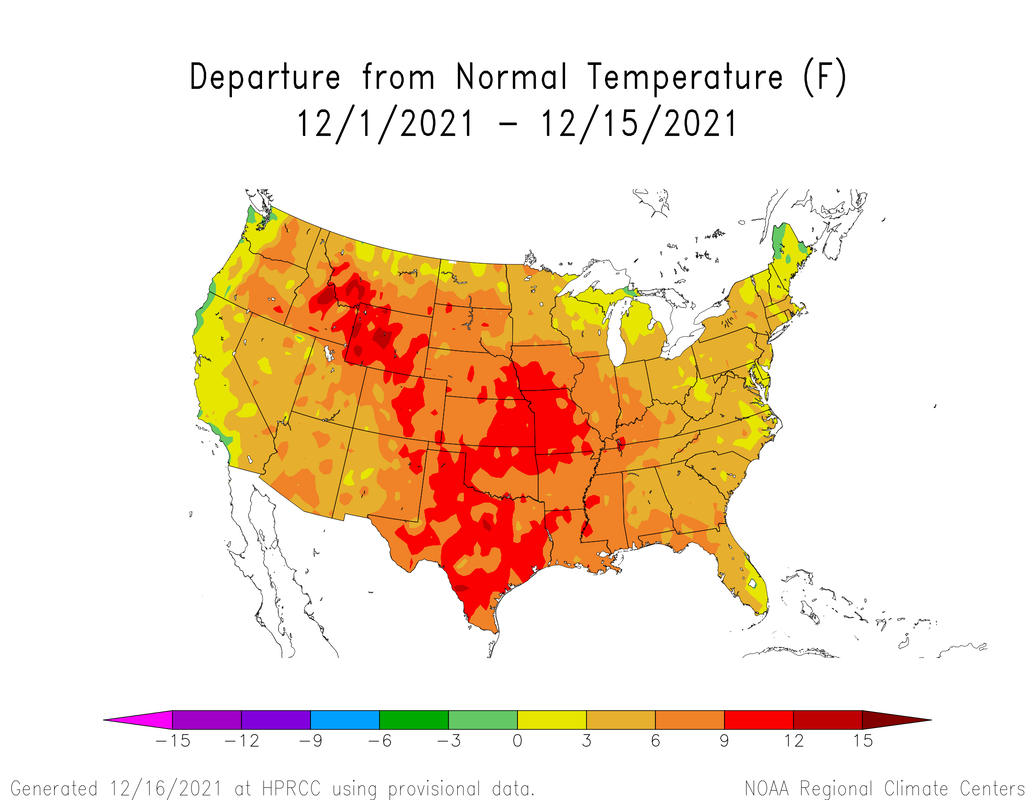 The direct culprit? A strong ridge of high pressure set up shop across the central US allowed for calmer, more unseasonable temperatures to happen. At the same time with a low pressure system to the west, warm, moist air from the Gulf of Mexico was advected or moved horizontally northward. This helped to allow the two severe weather events to occur. Having a quiet end to hurricane season allowed for the gulf to still have amorously warm surface water in mid-December. 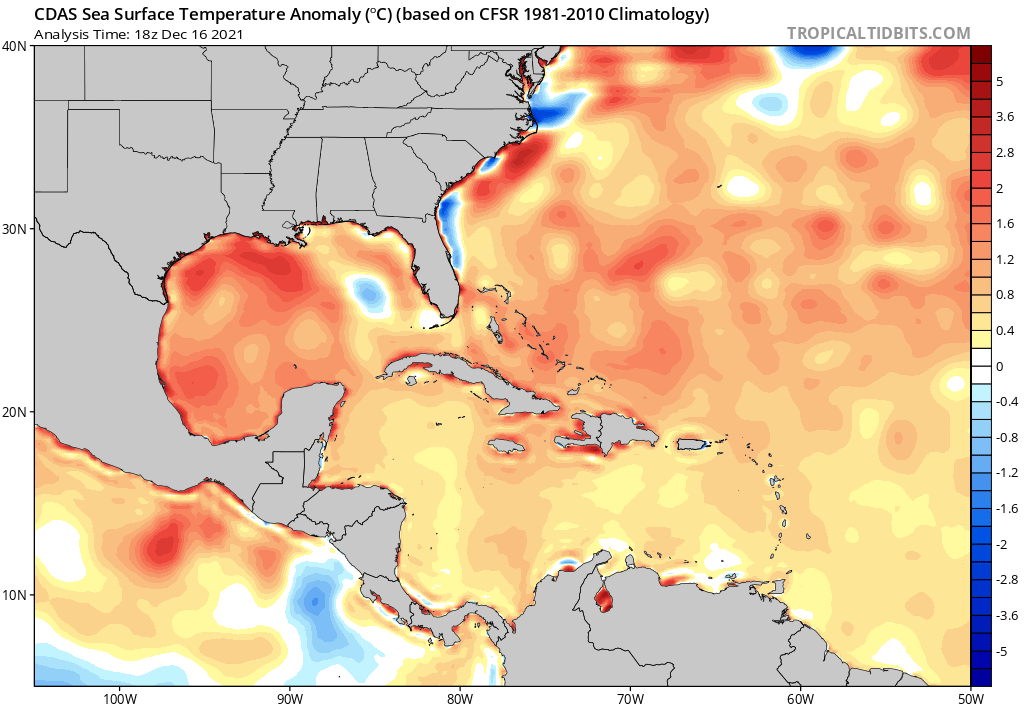 Analysis12/10/2021 At 12z on Dec 10th a trough was located in the western United States which would deepen as it traveled southeastward.
As this was occurring advection of warm moist air from the gulf into an increasingly unstable airmass in the Mississippi river valley. CAPE was in excess of 1000 j/kg, which is quite a bit for mid-December. Helicity was around 400 m^2/s^2. Helicity is just oner measure for wind shear, while CAPE is the most commonly used measure of instability. At 21z a surface low was posited over NE Kansas with a triple point of a cold front, warm front, and dry line. Around 9:00 CST in Valpo as I was walking home from working a volleyball game that the weird feeling air seemed familiar. I actually got 11/17/2013 vibes. Sometimes you can just tell the air isn't right.  Earlier in the day during the 16:30z update, the Storm prediction Center in Norman, OK had issued a moderate risk for the target area.  Soon enough the event started with storms initiating in Arkansas. Who would have thought that a single supercell would form in the warm sector and remain alive and strong for 400 miles! As of writing this post this quad state tornado was actually two separate tornados both rated EF4 with maximum winds of 190mph. There were quite a few wind reports and a couple EF0 tornados reported in Indiana. 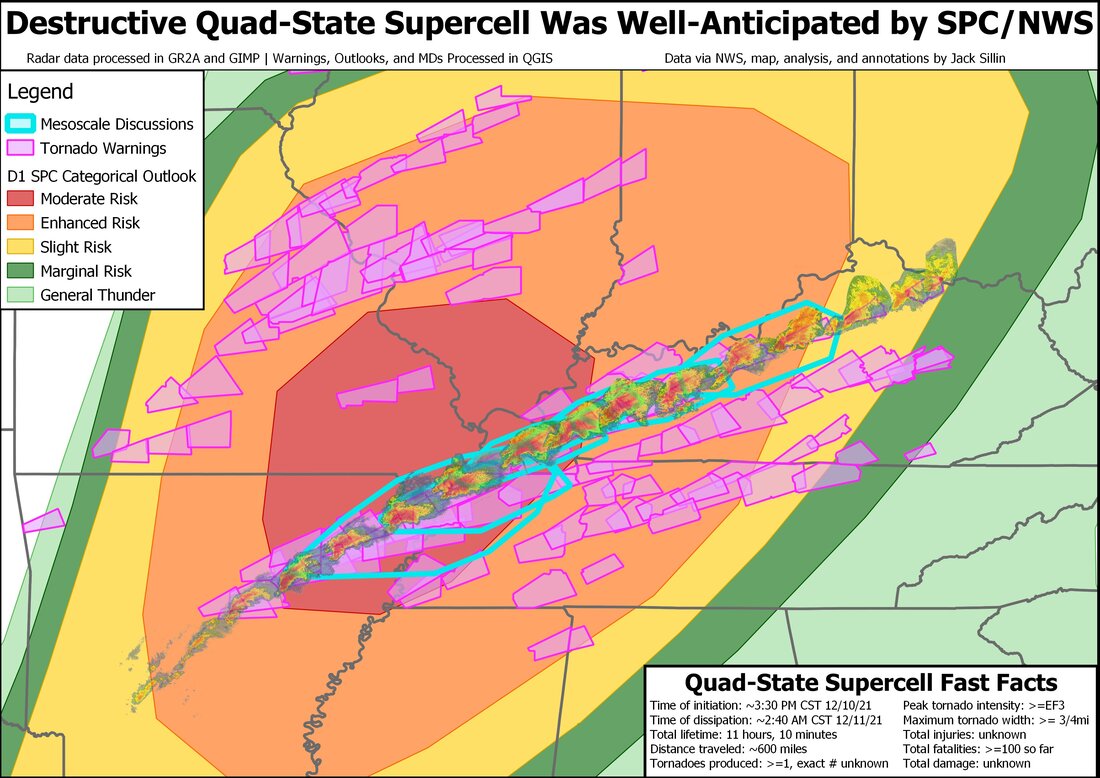 Courtesy of Jack Sillin @JackSillin 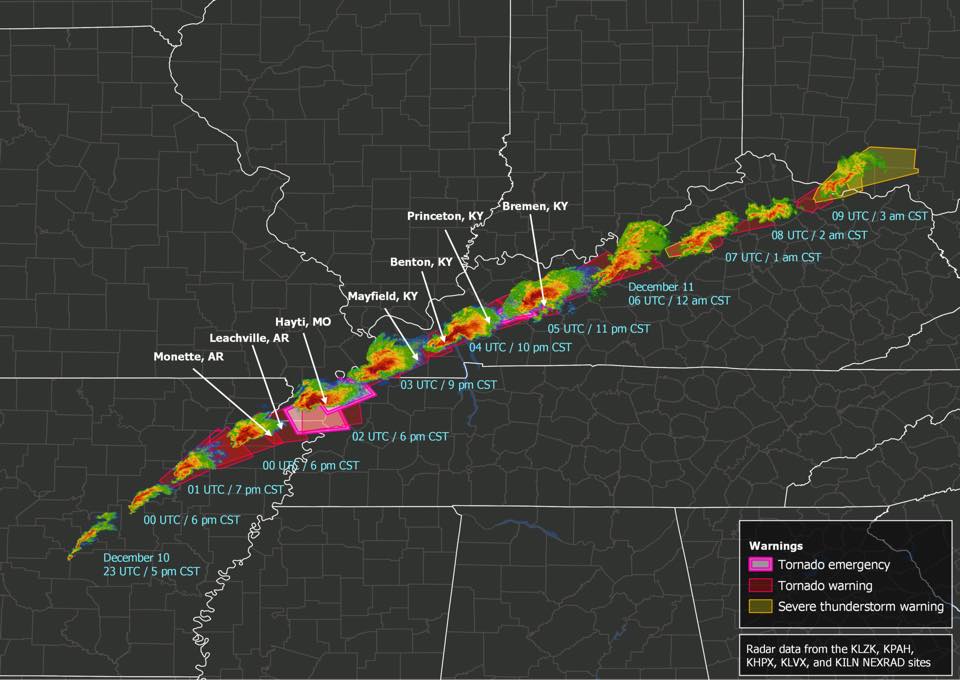 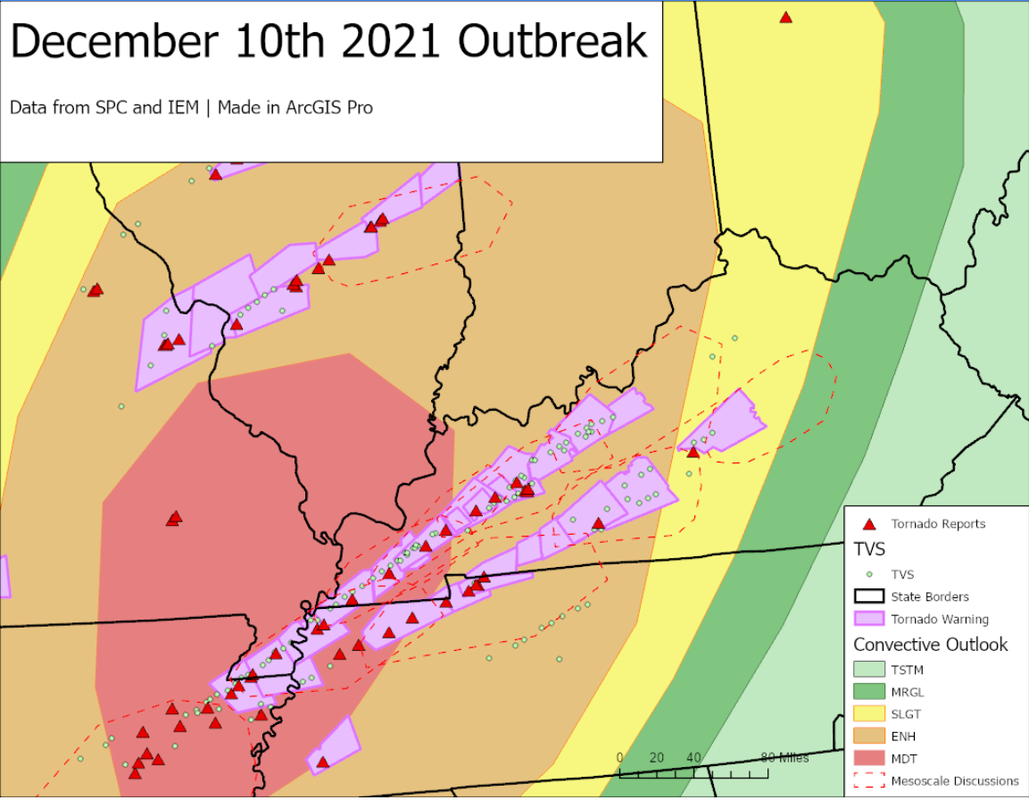 Note: I created this graphic myself with a GIS software and only included tornado warnings with observed tornados with this particular one.  12/15/2021 This event was a record breaker. There were 54 significant wind reports of 65 kts (75 mph) winds within a serial derecho that traveled around 700 miles at 63 mph.  Here is a comparison between the latest derecho and the August Iowa derecho. Here is some information on derechos if you need a refresher. This most recent derecho was a serial derecho that traveled ahead of a cold front, like many squall lines that affect the midwest in the summer. A progressive derecho like the Iowa derecho last year or the June 30th, 2012 derecho ride on top of stationary front that we can sometimes see in northwest flow type patterns in the summer. 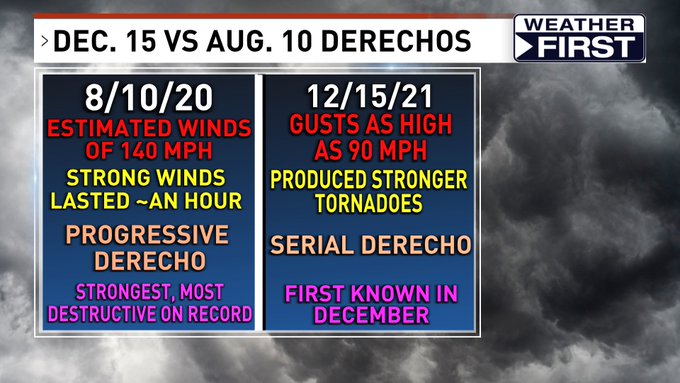 Now for a little analysis time. At the jet stream level (300mb) a trough dug into the four corners region heading northeast.
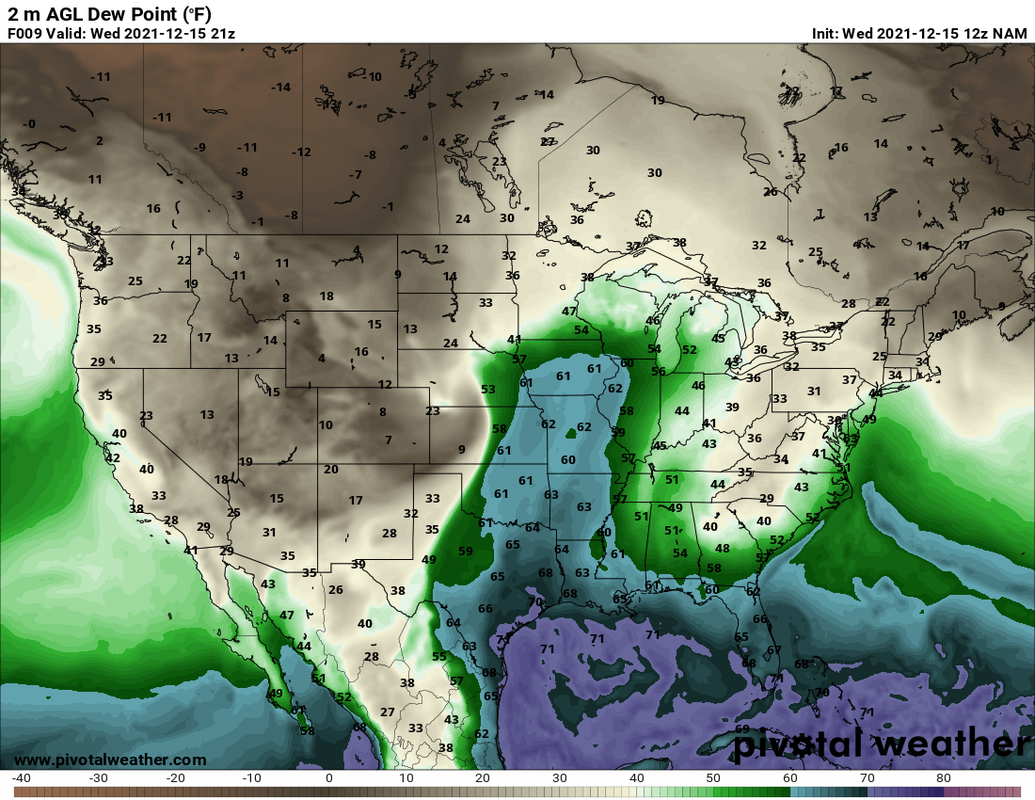
At 850mb, there was a clear low level jet which brought in the tropical air northward. The fact the central plains were in between a trough and a ridge certainly helped advect that unstable air. The surface air was very warm and moist for this time of year. 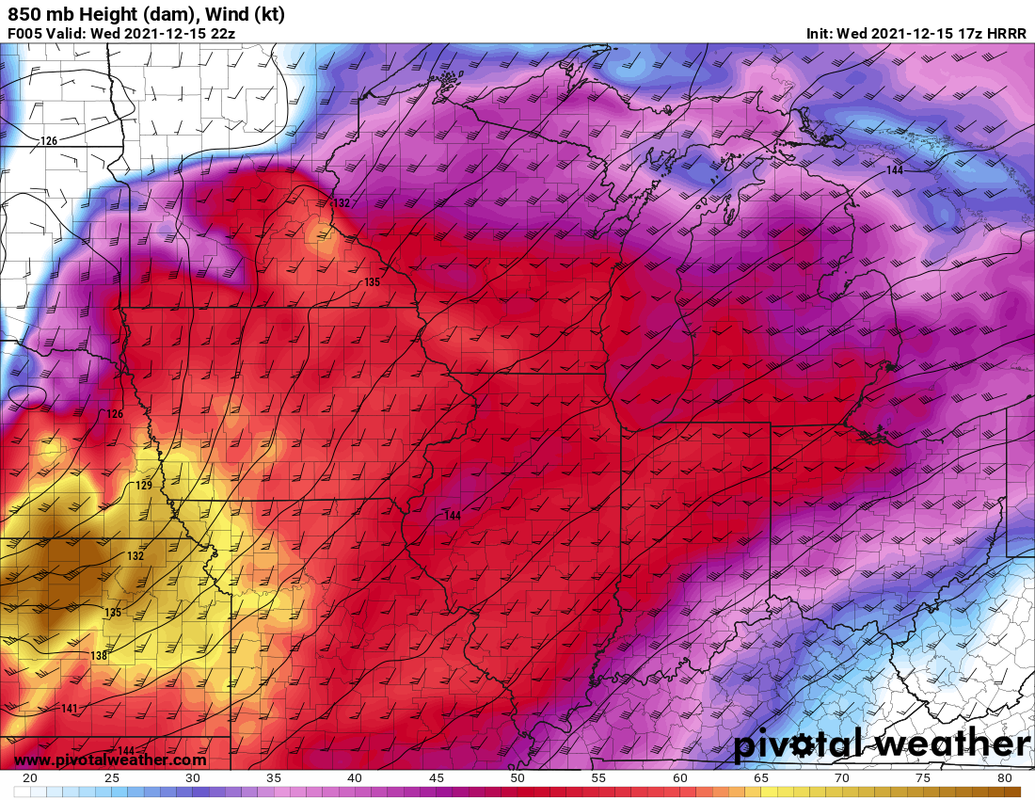 
 This isnt a great graphic, but it shows the non-thunderstorm winds. This was a strong low pressure system that underwent cyclonegenesis in the lee of the Rocky mountains. 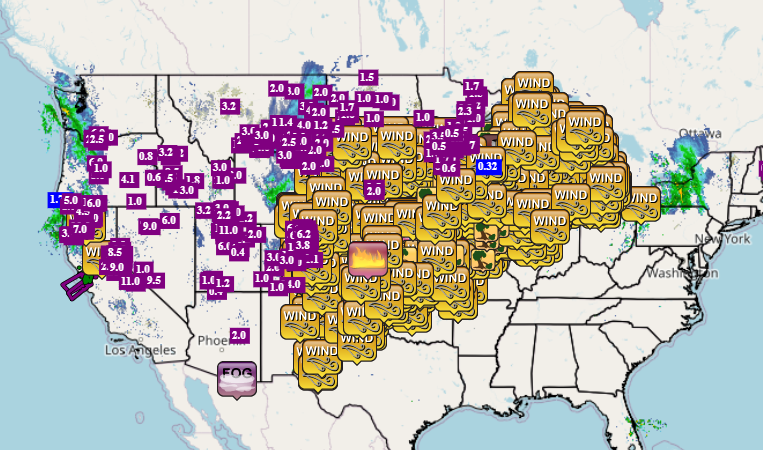  Do you see the brown lines and how close they are.? These are isobars or lines representing areas of equal pressure. Generally speaking, the closer the isobars are to each other, the windier it is due to the stronger pressure gradient. When the dryline and cold front passed the pressure gradient increased and what is called a sting jet developed with the stronger winds aloft being mixed down to the surface in the cold conveyer belt of the belt (the idea that there is cold air coming down behind the cold front.) For us locally the highest gust of 63mph were recorded in Whitestown. All that to say the weather has been quite warm recently. It's felt more like spring. So you are probably asking what the chances for a white Christmas are. I will say, the chances are not great... 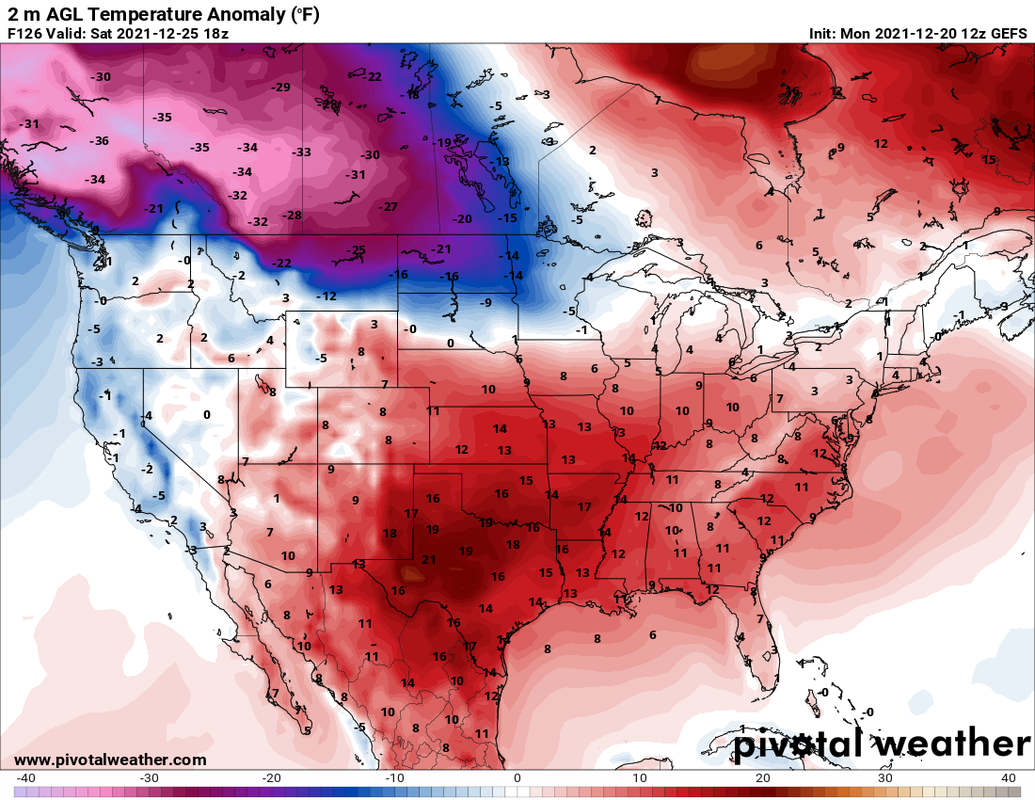 |
 RSS Feed
